Evidence-based guide
Pigment Particle Size: Read D50, D90 and Grind Results Correctly
Pigment particle size helps explain how a colorant behaves in paint, but a number without a measurement method tells you very little. Before comparing two grades, check what was measured: individual particles, clusters in a dispersion, or the coarse material detected by a grind gauge. Then read the distribution, not just its midpoint.
Imagine two supplier reports that both say “D50: 0.30 µm.” That looks like a match. Yet one report could describe a much coarser upper tail, or use a different way of weighting the particles. This guide shows which questions to ask before treating those numbers as interchangeable.
What does pigment particle size actually describe?
A pigment powder is not necessarily a collection of separate, identical grains. Small particles can join into larger structures, and the way a sample is dispersed affects what a measurement sees. The supplied textbook Pigment Chemistry and Technology, chapter 2, sections 2.4.1–2.4.3, distinguishes particle properties, observation methods and particle associations. Its useful lesson here is that the sample’s physical state belongs alongside its chemical identity.
A size specification should therefore identify the material and its preparation. Was the sample measured as supplied, after dispersing it in a liquid, or after a defined treatment? A result for a prepared laboratory dispersion does not automatically describe every cluster present in the paint container.
Keep the units visible: 1 µm equals 1,000 nm, so 0.30 µm and 300 nm express the same length. Converting units is straightforward; converting between different measurement definitions is not.
How to read D50 particle size and the rest of the distribution
D50 is a median, but you must know what is being divided in half. With volume-based notation, Dv50 marks the diameter below which half of the measured particle volume lies. It does not mean that half the particles, counted individually, are smaller. Dv10 and Dv90 mark the corresponding 10% and 90% volume points. See Malvern Panalytical’s guide to distribution statistics.
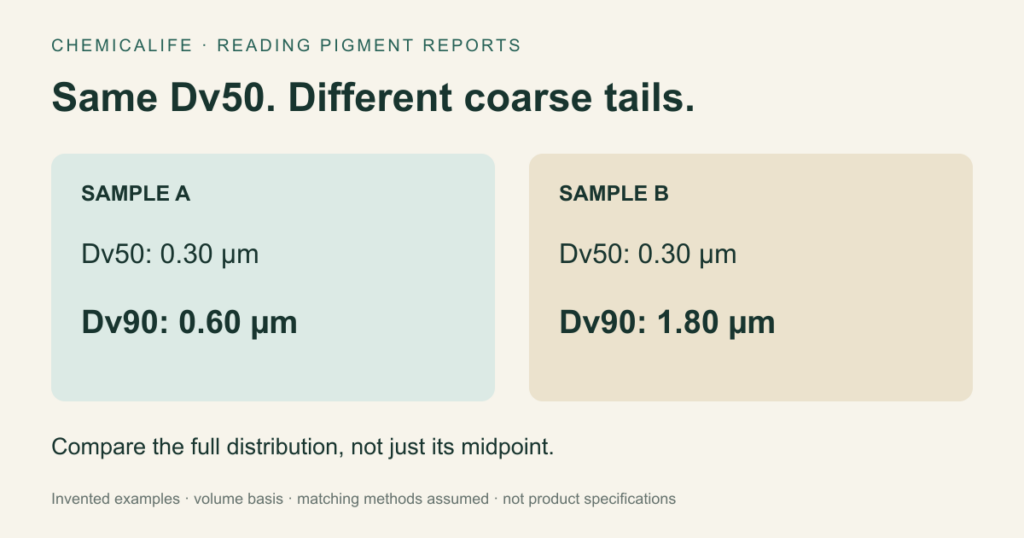
Use the following invented reports to practice reading those numbers. They are teaching examples, not specifications for a real pigment or recommended size targets. Assume both reports use the same method, sample preparation and volume basis.
| Reported value | Sample A | Sample B |
|---|---|---|
| Dv10 | 0.12 µm | 0.12 µm |
| Dv50 | 0.30 µm | 0.30 µm |
| Dv90 | 0.60 µm | 1.80 µm |
The shared median does not make these distributions equivalent. Sample B reaches its 90% volume point at a diameter three times that of A. That is a reason to investigate the coarse end, not proof that B will perform badly. Also, 1.80 µm is not B’s largest particle size: Dv90 leaves a portion of the distribution above it.
A useful follow-up would be: “Please send the full distribution curves and confirm whether the two samples were prepared and measured the same way.” That question is more productive than asking which D50 is better when the two medians are identical.
A Hegman gauge answers a different question
A grind gauge is useful for checking coarse particles or agglomerates in a dispersion. It does not provide a complete pigment particle size distribution. BYK’s description of its grindometer explains how material is drawn along grooves of decreasing depth and assessed where particles or their traces appear.
Suppose a batch passes its established grind check but has an unexpected color difference. The passing result is still useful: it answers the question that check was designed to answer. It does not establish that the batch has the same median, distribution shape or color performance as a reference batch.
Do not turn a grind reading into a D50 value by changing the unit label. Keep the grind result and the distribution report as separate observations. If an acceptance specification requires both, one cannot substitute for the other.
Does a smaller pigment always make better paint?
No single particle size wins across all pigments and applications. Size and distribution can affect appearance and flow, while chemistry, shape, dispersion and the rest of the formulation also matter. For example, a change made to alter color strength may also change viscosity or gloss. Malvern Panalytical’s coatings overview discusses these interacting properties and why a distribution is more informative than a lone average.
When comparing two paint samples, write down the outcome you need before looking at their size numbers. “Cover this dark substrate at the specified film thickness” is a testable requirement. “Use the smallest pigment” is not an adequate substitute. Our guide to paint hiding power explains why coverage needs its own comparison.
Likewise, a pigment’s family name cannot supply a missing particle-size report. The organic versus inorganic pigment comparison covers what those chemical classifications can and cannot tell you.
A short checklist for comparing supplier reports
- Match the identity. Record the grade, batch and sample state. A familiar color name is not a batch identifier.
- Keep the method attached. Ask which instrument technique and preparation procedure produced the result. Do not silently combine results from unlike methods.
- Read the basis and units. Preserve labels such as Dv50. If a sheet says only “average size,” ask which statistic it means.
- Look beyond the midpoint. Request the curve and reported percentiles. A matching median can conceal a different coarse tail.
- Check the application separately. Compare the paint property you actually need, under agreed conditions, against a reference.
For a purchasing note, try this format: “The two grades share a reported Dv50, but their Dv90 values differ. We need matching method details and an application comparison before treating them as substitutes.” It states what the reports show without turning an incomplete comparison into a quality verdict.
Questions worth asking before you choose a grade
Is D50 the average particle size?
It is the median for the stated distribution basis. If someone calls it an average, preserve the more precise D50 label in your notes. Do not assume that a separately reported mean must have the same value.
Can two pigments with the same D50 behave differently?
Yes. The example above already shows how their upper percentiles can differ. Their chemistry, shape, preparation and formulation may also differ. Matching one statistic leaves those questions open.
What should I request if the data sheet gives just one number?
Ask what the number represents, how the sample was prepared, which measurement method was used, and whether a full distribution is available. Until then, label the comparison incomplete rather than filling the gaps with assumptions.
Continue with the pigment chemistry guide for the other properties used to describe colorants. This article is an educational guide to reading reports, not a laboratory procedure or a product certification.